
Attack Surface Management
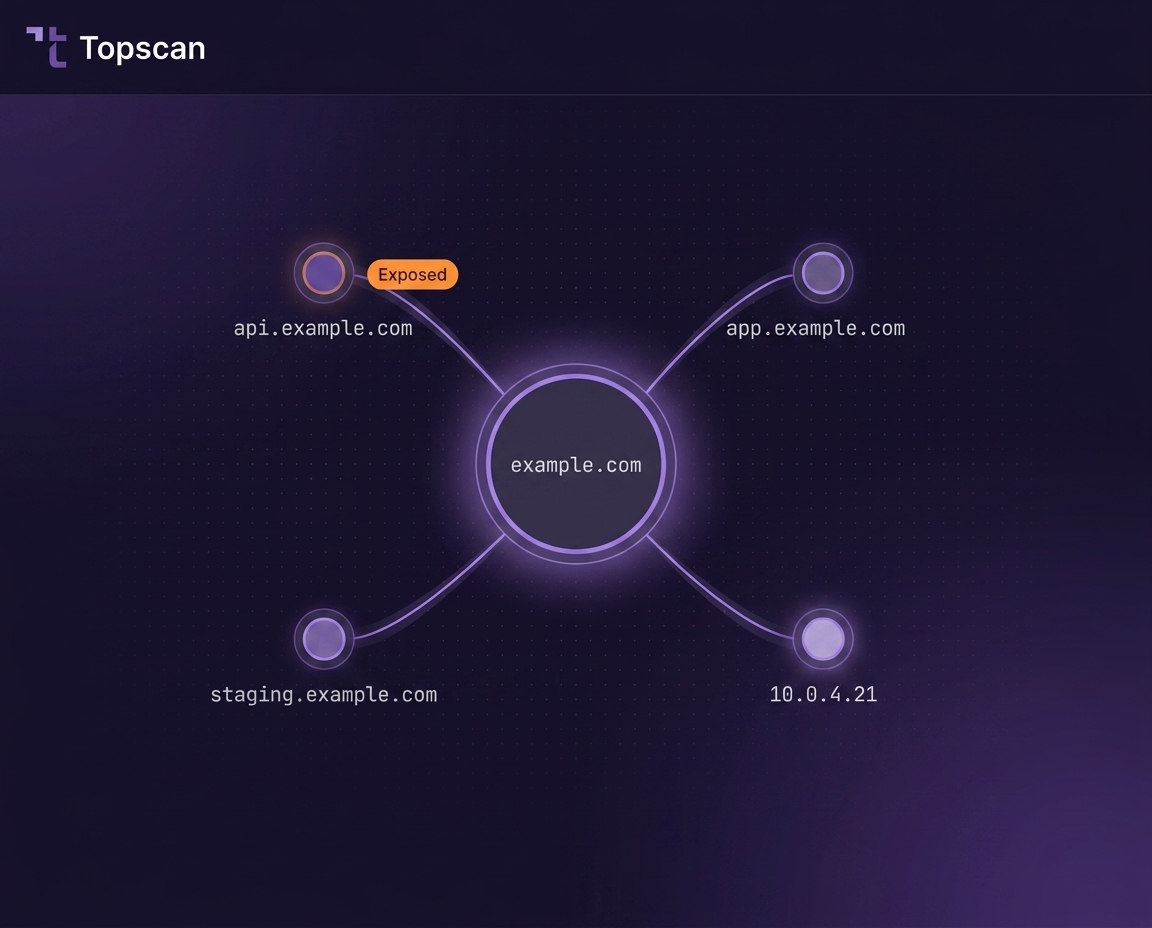
Topscan maps your external infrastructure, tracks change across internet-facing assets, and helps your team identify exposure before it turns into a real threat.
Challenges & Solutions
Infrastructure changes fast. Hidden assets, open ports, and expired certificates create exposure long before anyone notices.
Challenges
- Unknown assets appear outside your tracked inventory
- A deployment opens a service you did not mean to expose
- Certificate expiry reaches users before your team sees it
- Audit questions arrive with no clear activity history
- Leadership asks for risk status in plain language
Solutions
- Topscan runs asset discovery across your organization's subdomains, IPs, APIs, and exposed assets
- Continuous monitoring records drift in ports, services, and configurations (coming soon)
- SSL/TLS tracking warns before certificate problems become visible
- Activity log keeps a timestamped trail of external changes
- Host Profile turns raw findings into a readable security view
How Topscan Attack Surface Management Works
Step 1 - Add a target
Start with a domain or IP. Topscan begins mapping your external environment without manual asset lists.
Step 2 - Build the host view
Each discovered asset gets a profile with the details your security team would otherwise gather by hand. You see what is exposed and why it matters.
Step 3 - Monitor for change
Topscan compares new scan data to the previous state. When exposure changes, the attack surface management platform records it; change alerts are coming soon.
Step 4 - Use history to act and explain
Historical records help you assess risk, track infrastructure changes, and show leadership what changed over time - all in one workflow.
Step 1 - Add a target
Start with a domain or IP. Topscan begins mapping your external environment without manual asset lists.
- Domain and IP input
- Automatic discovery of related assets
- No manual inventory setup
Step 2 - Build the host view
Each discovered asset gets a profile with the details your security team would otherwise gather by hand. You see what is exposed and why it matters.
- Open ports
- Running services
- Detected technologies
- SSL/TLS status
Step 3 - Monitor for change
Topscan compares new scan data to the previous state. When exposure changes, the attack surface management platform records it; change alerts are coming soon.
- Scheduled scanning
- Change detection (coming soon)
- Drift visibility (coming soon)
- Timestamped events
Step 4 - Use history to act and explain
Historical records help you assess risk, track infrastructure changes, and show leadership what changed over time - all in one workflow.
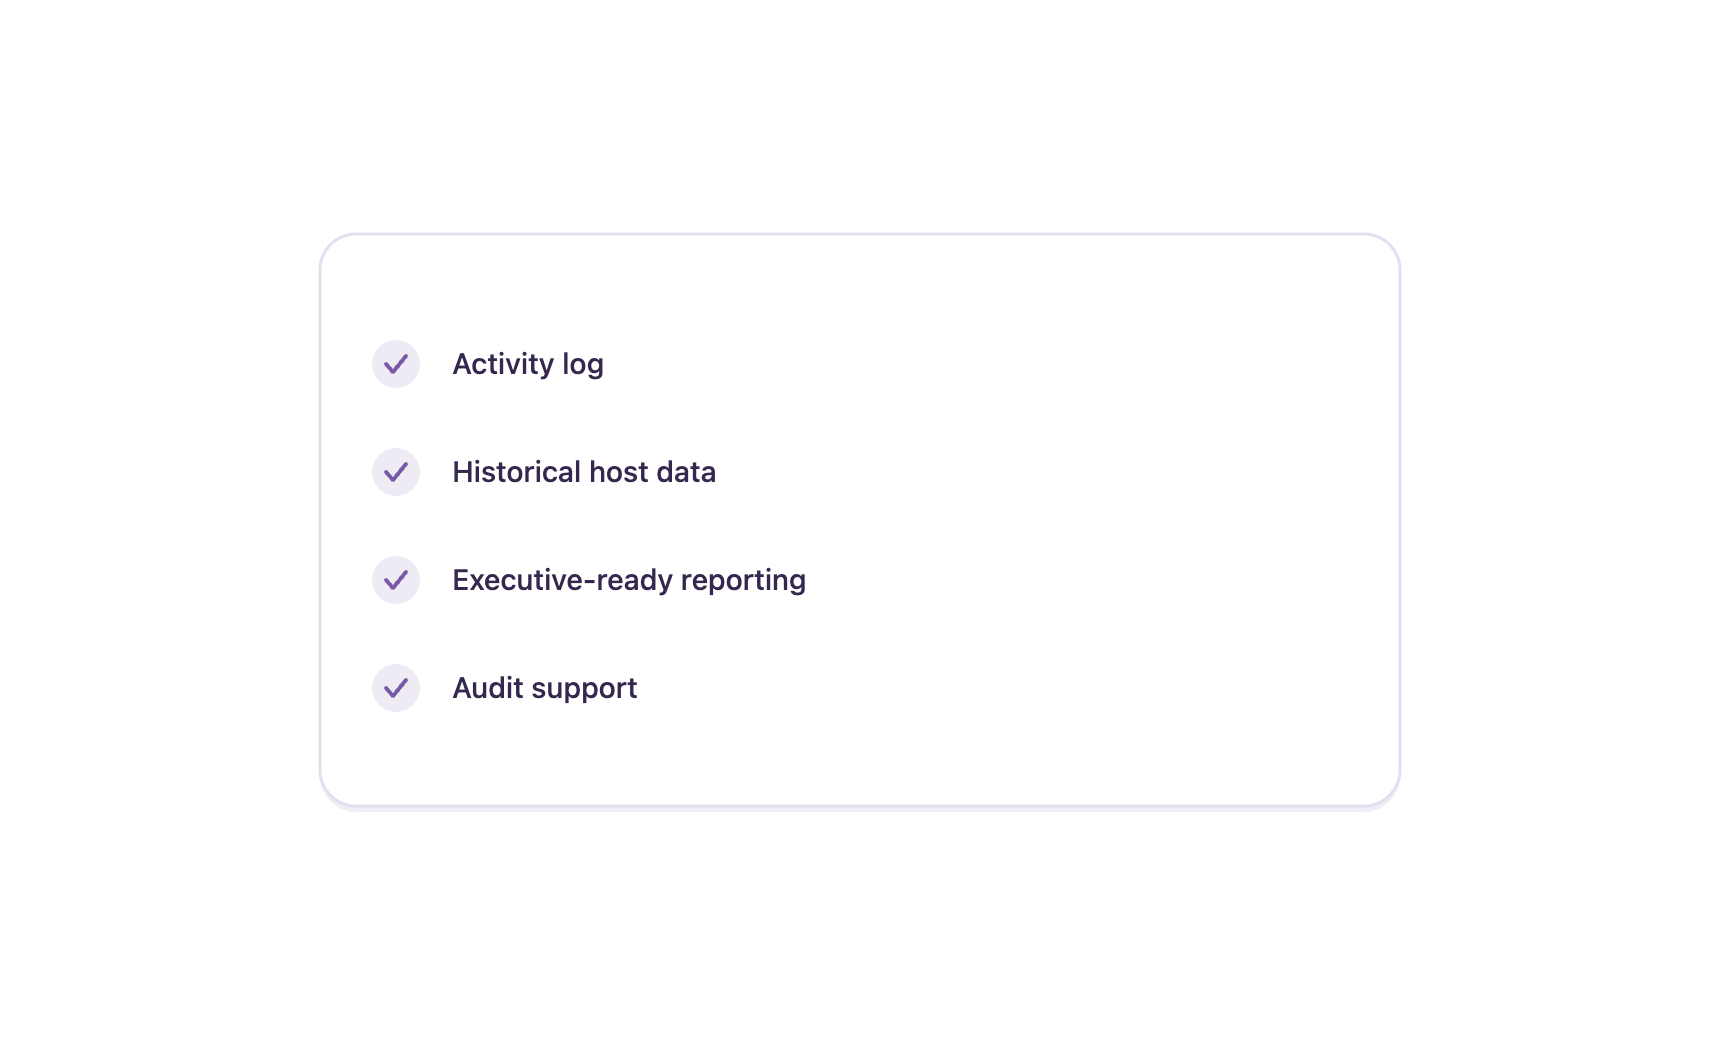
- Activity log
- Historical host data
- Executive-ready reporting
- Audit support
Features & Capabilities
Automatic Asset Discovery
Discover subdomains, IPs, APIs, and exposed services as your footprint grows.
Continuous Monitoring
Keep attack surface visibility current with scheduled external scanning to enable your team to act on real changes.
Host Profile
Review ports, services, technologies, and certificate status in one place to help secure your infrastructure.
SSL/TLS Tracking
Catch certificate issues before they affect users or trust - and gain insight into SSL/TLS health across your stack.
Activity Log
Preserve a timestamped record of infrastructure events and findings.
Change Detection
Spot new services, port changes, and configuration drift without manual checks. (coming soon)
Who Topscan Is Built For
CTO
Get one clear view of external exposure, vulnerability signals, and change without adding another fragmented workflow.
Head of DevOps
Track cloud-facing assets, automate drift detection, and reduce manual checks across a changing environment.
Senior DevOps Engineer
Discover forgotten services and keep monitoring tied to real infrastructure changes.
Engineering Manager
Understand what is exposed and give leadership a plain-language status update with less back-and-forth.
Tech Lead
Use historical records and reporting to support audit readiness for SOC 2 or ISO 27001 preparation.
Cloud Infrastructure Teams
Keep visibility across internet-facing systems as services, domains, and endpoints keep changing.
About Topscan
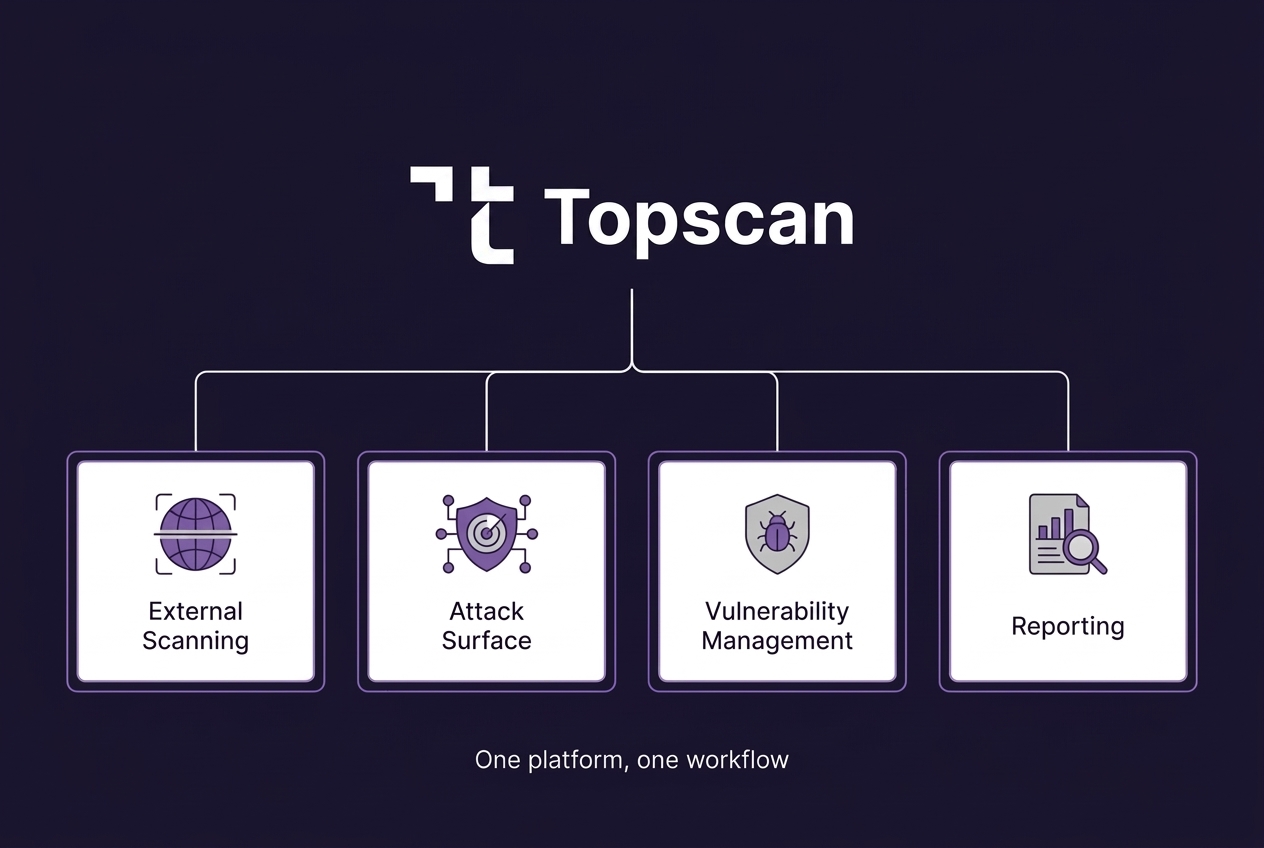
Topscan is EASM software that helps software teams manage cyber exposure without adding another fragmented security workflow.
The platform combines asset discovery, external perimeter scanning, vulnerability management, reporting, and workflow support into one solution.
Technical owners can see what is exposed, prioritize what matters, and explain security status to leadership, customers, and auditors. The focus is clear visibility, practical prioritization, and reporting that fits day-to-day engineering work.
FAQ
Topscan builds on the best in class scanning engines
Still have questions?
Contact us