
Overview tab
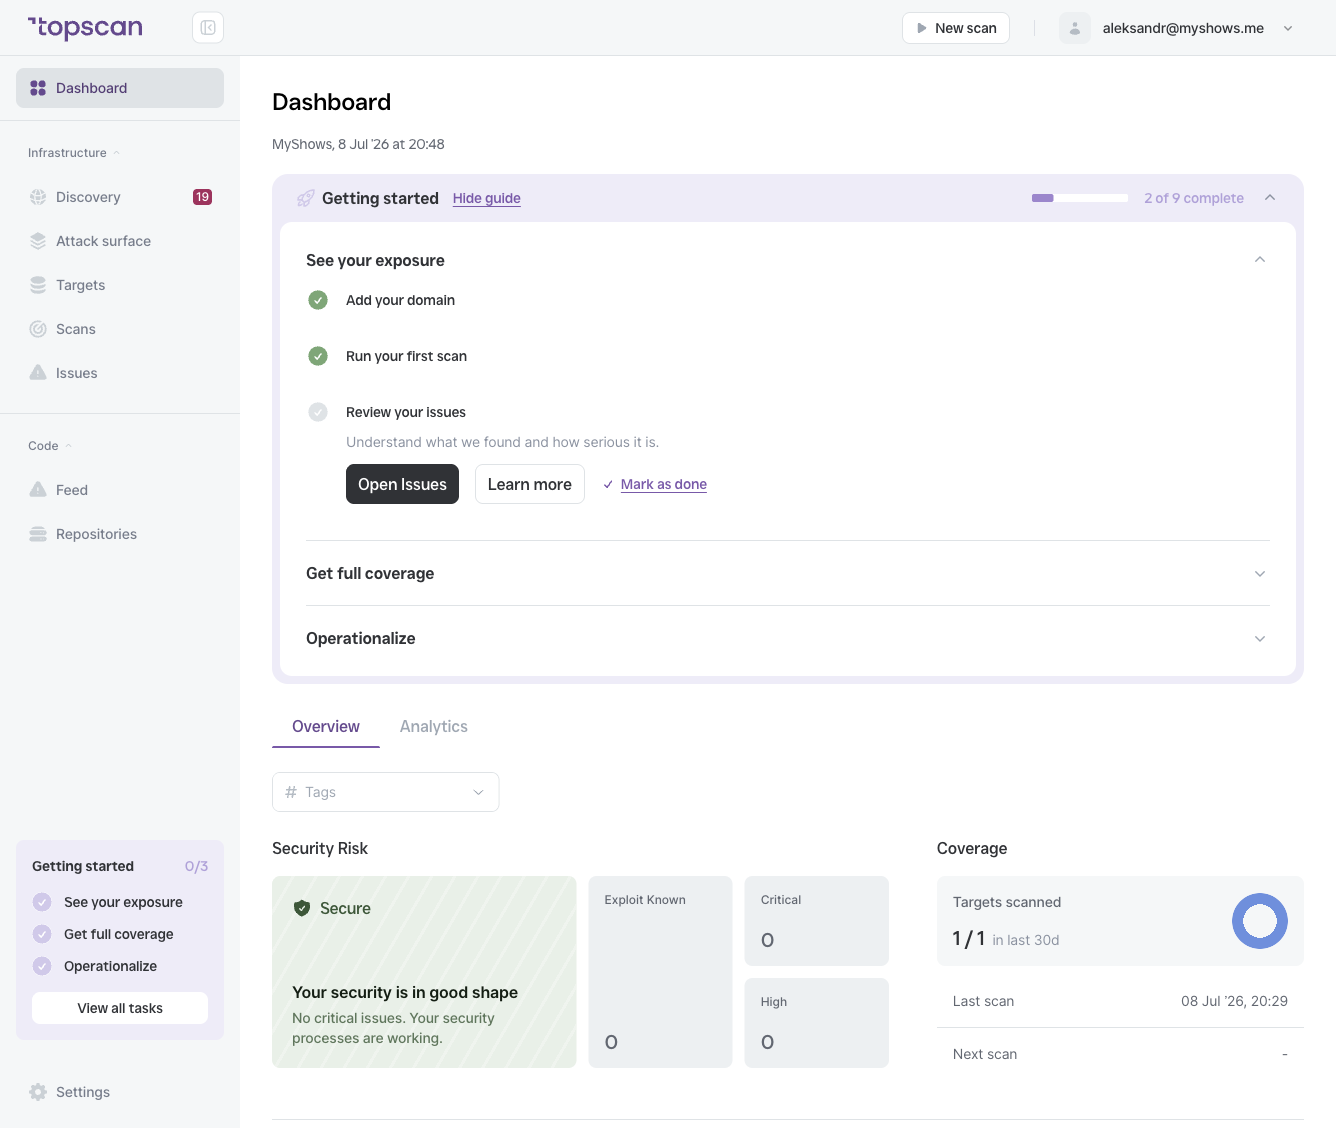
Security Risk
The Security Risk panel gives you an at-a-glance verdict on your workspace's posture:
- Status — an overall state with a short explanation. Secure means no critical issues and your processes are keeping up; At Risk appears when open high-severity problems need attention.
- Exploit Known — the number of open issues that have a known public exploit. Treat these as top priority regardless of CVSS score.
- Critical / High — the count of open CRITICAL and HIGH issues across all targets. These carry the biggest penalties if left unresolved past their SLA deadline.
Coverage
Coverage tells you how much of your attack surface has been scanned recently.
| Field | What it means |
|---|---|
| Targets scanned | How many of your targets have been scanned in the last 30 days vs. total targets |
| Last scan | When the most recent scan completed |
| Next scan | When the next scheduled scan is due to run |
If coverage is low, some of your targets may not have been scanned in a while. Go to Scans → Scheduled to check your scan schedule.
Issues to fix
A prioritized list of the most urgent open issues. Each row shows the CVSS score, the issue title, how many targets it affects, and its SLA countdown (e.g. expires in 59d). Issues that have passed their deadline show as overdue and are actively reducing your standing.
Click Show all to go to the full Issues view with filtering and search.
SLA Compliance Rate
The percentage of issues that were fixed within their SLA deadline. A rate of 100% means every issue in your workspace was resolved before its deadline expired.
This metric is calculated across all time, not just the current period.
Activity
A live feed of recent events in your workspace: completed scans, new issues found, team members added or removed, and scan failures. Click Show all to see the full activity log with date filtering.